Datei:Tautochrone curve.gif
Tautochrone_curve.gif (300 × 200 Pixel, Dateigröße: 102 KB, MIME-Typ: image/gif, Endlosschleife, 80 Bilder, 3,2 s)
Diese Datei stammt aus Wikimedia Commons und kann von anderen Projekten verwendet werden. Die Beschreibung von deren Dateibeschreibungsseite wird unten angezeigt.
Beschreibung
| BeschreibungTautochrone curve.gif |
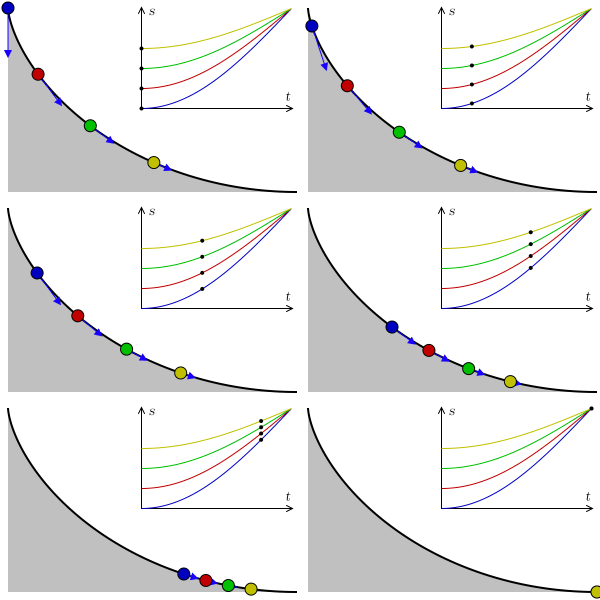
A tautochrone curve is the curve for which the time taken by an object sliding without friction in uniform gravity to its lowest point is independent of its starting point. Here, four points at different positions reach the bottom at the same time. In the graphic, s represents arc length, t represents time, and the blue arrows represent acceleration along the trajectory. As the points reach the horizontal, the velocity becomes constant, the arc length being linear to time. |
| Datum | 9. Mai 2007; new version August 2009 |
| Quelle | Eigenes Werk |
| Urheber |
Claudio Rocchini |
| GIF‑Erstellung InfoField | Dieser Plot wurde mit Matplotlib erstellt. |
| Quelltext InfoField | Python code#!/usr/bin/python
# -*- coding: utf8 -*-
'''
animation of balls on a tautochrone curve
'''
import os
import numpy as np
import matplotlib.pyplot as plt
import matplotlib.patches as patches
from matplotlib import animation
from math import *
# settings
fname = 'Tautochrone curve'
width, height = 300, 200
nframes = 80
fps=25
balls = [
{'a':1.0, 'color':'#0000c0'},
{'a':0.8, 'color':'#c00000'},
{'a':0.6, 'color':'#00c000'},
{'a':0.4, 'color':'#c0c000'}]
def curve(phi):
x = phi + sin(phi)
y = 1.0 - cos(phi)
return np.array([x, y])
def animate(nframe, empty=False):
t = nframe / float(nframes - 1.)
# prepare a clean and image-filling canvas for each frame
fig = plt.gcf()
fig.clf()
ax_canvas = plt.gca()
ax_canvas.set_position((0, 0, 1, 1))
ax_canvas.set_xlim(0, width)
ax_canvas.set_ylim(0, height)
ax_canvas.axis('off')
# draw the ramp
x0, y0 = 293, 8
h = 182
npoints = 200
points = []
for i in range(npoints):
phi = i / (npoints - 1.0) * pi - pi
x, y = h/2. * curve(phi) + np.array([x0, y0])
points.append([x, y])
rampline = patches.Polygon(points, closed=False, facecolor='none',
edgecolor='black', linewidth=1.5, capstyle='butt')
points += [[x0-h*pi/2, y0], [x0-h*pi/2, y0+h]]
ramp = patches.Polygon(points, closed=True, facecolor='#c0c0c0', edgecolor='none')
# plot axes
plotw = 0.5
ax_plot = fig.add_axes((0.47, 0.46, plotw, plotw*2/pi*width/height))
ax_plot.set_xlim(0, 1)
ax_plot.set_ylim(0, 1)
for b in balls:
time_array = np.linspace(0, 1, 201)
phi_pendulum_array = (1 - b['a'] * np.cos(time_array*pi/2))
ax_plot.plot(time_array, phi_pendulum_array, '-', color=b['color'], lw=.8)
ax_plot.set_xticks([])
ax_plot.set_yticks([])
ax_plot.set_xlabel('t')
ax_plot.set_ylabel('s')
ax_canvas.add_patch(ramp)
ax_canvas.add_patch(rampline)
for b in balls:
# draw the balls
phi_pendulum = b['a'] * -cos(t * pi/2)
phi_wheel = 2 * asin(phi_pendulum)
phi_wheel = -abs(phi_wheel)
x, y = h/2. * curve(phi_wheel) + np.array([x0, y0])
ax_canvas.add_patch(patches.Circle((x, y), radius=6., zorder=3,
facecolor=b['color'], edgecolor='black'))
ax_plot.plot([t], [1 + phi_pendulum], '.', ms=6., mec='none', mfc='black')
v = h/2. * np.array([1 + cos(phi_wheel), sin(phi_wheel)])
vnorm = v / hypot(v[0], v[1])
# in the harmonic motion, acceleration is proportional to -position
acc_along_line = 38. * -phi_pendulum * vnorm
ax_canvas.arrow(x, y, acc_along_line[0], acc_along_line[1],
head_width=6, head_length=6, fc='#1b00ff', ec='#1b00ff')
fig = plt.figure(figsize=(width/100., height/100.))
print 'saving', fname + '.gif'
#anim = animation.FuncAnimation(fig, animate, frames=nframes)
#anim.save(fname + '.gif', writer='imagemagick', fps=fps)
frames = []
for nframe in range(nframes):
frame = fname + '_{:02}.png'.format(nframe)
animation.FuncAnimation(fig, lambda n: animate(nframe), frames=1).save(
frame, writer='imagemagick')
frames.append(frame)
# assemble animation using imagemagick, this avoids dithering and huge filesize
os.system('convert -delay {} +dither +remap -layers Optimize {} "{}"'.format(
100//fps, ' '.join(['"' + f + '"' for f in frames]), fname + '.gif'))
for frame in frames:
if os.path.exists(frame):
os.remove(frame)
|
Lizenz

|
Es ist erlaubt, die Datei unter den Bedingungen der GNU-Lizenz für freie Dokumentation, Version 1.2 oder einer späteren Version, veröffentlicht von der Free Software Foundation, zu kopieren, zu verbreiten und/oder zu modifizieren; es gibt keine unveränderlichen Abschnitte, keinen vorderen und keinen hinteren Umschlagtext.
Der vollständige Text der Lizenz ist im Kapitel GNU-Lizenz für freie Dokumentation verfügbar.http://www.gnu.org/copyleft/fdl.htmlGFDLGNU Free Documentation Licensetruetrue |
| Diese Datei ist unter der Creative-Commons-Lizenz „Namensnennung – Weitergabe unter gleichen Bedingungen 3.0 nicht portiert“ lizenziert. | ||
| ||
| Diese Lizenzmarkierung wurde auf Grund der GFDL-Lizenzaktualisierung hinzugefügt.http://creativecommons.org/licenses/by-sa/3.0/CC BY-SA 3.0Creative Commons Attribution-Share Alike 3.0truetrue |
- Dieses Werk darf von dir
- verbreitet werden – vervielfältigt, verbreitet und öffentlich zugänglich gemacht werden
- neu zusammengestellt werden – abgewandelt und bearbeitet werden
- Zu den folgenden Bedingungen:
- Namensnennung – Du musst angemessene Urheber- und Rechteangaben machen, einen Link zur Lizenz beifügen und angeben, ob Änderungen vorgenommen wurden. Diese Angaben dürfen in jeder angemessenen Art und Weise gemacht werden, allerdings nicht so, dass der Eindruck entsteht, der Lizenzgeber unterstütze gerade dich oder deine Nutzung besonders.
Kurzbeschreibungen
In dieser Datei abgebildete Objekte
Motiv
Einige Werte ohne einen Wikidata-Eintrag
image/gif
Dateiversionen
Klicke auf einen Zeitpunkt, um diese Version zu laden.
| Version vom | Vorschaubild | Maße | Benutzer | Kommentar | |
|---|---|---|---|---|---|
| aktuell | 14:15, 1. Aug. 2009 |  | 300 × 200 (102 KB) | wikimediacommons>Geek3 | new physically correct version |
Dateiverwendung
Die folgende Seite verwendet diese Datei:
