Datei:Spherical harmonics positive negative.svg

Größe der PNG-Vorschau dieser SVG-Datei: 265 × 251 Pixel. Weitere Auflösungen: 253 × 240 Pixel | 507 × 480 Pixel | 811 × 768 Pixel | 1.081 × 1.024 Pixel | 2.162 × 2.048 Pixel.
Originaldatei (SVG-Datei, Basisgröße: 265 × 251 Pixel, Dateigröße: 22 KB)
Beschreibung
| Beschreibung |
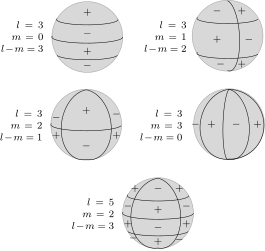
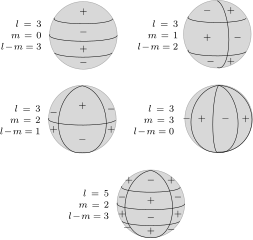
English: Representation of a spherical harmonic by discrepancy to a sphere. |
| Datum | |
| Quelle | Eigenes Werk |
| Urheber | Krishnavedala |
W3C-validity not checked.
| LaTeX source code |
|---|
\documentclass[12pt,border=1pt,tikz,class=scrartcl]{standalone}
\usepackage[T1]{fontenc}
\usepackage[utf8]{inputenc}
\usepackage{lmodern}
\usepackage{mathtools}

\usepackage{tikz-3dplot}
\usetikzlibrary{arrows,shapes,calc,positioning,matrix,fit}

\begin{document}
\scriptsize
\tdplotsetmaincoords{100}{170}
\begin{tikzpicture}[very thick,auto,
	info box/.style={align=right, text width=4em}]
	\node at (0,0) (p1) {\begin{tikzpicture}
		\draw[tdplot_screen_coords, fill=white!70!gray] (0,0) circle (1);
		\tdplotsinandcos {\sintheta}{\costheta}{0}
		\tdplotdrawarc {(0,0,-\sintheta)} {\costheta} {0} {-190} {} {}
		\tdplotsinandcos {\sintheta}{\costheta}{-30}
		\tdplotdrawarc {(0,0,-\sintheta)} {\costheta} {0} {-190} {} {}
		\tdplotsinandcos {\sintheta}{\costheta}{30}
		\tdplotdrawarc {(0,0,-\sintheta)} {\costheta} {-20} {-180} {} {}
		\node at (0,.7) {$+$};		\node at (0,.1) {$-$};
		\node at (0,-.4) {$+$};	\node at (0,-.8) {$-$};
	\end{tikzpicture}
	};
	\node [left=-.3em of p1,info box] {$l=3$\\$m=0$\\$l-m=3$};
	\node at (4,0) (p2) {\begin{tikzpicture}
		\draw[tdplot_screen_coords, fill=white!70!gray] (0,0) circle (1);
		\tdplotsinandcos {\sintheta}{\costheta}{-30}
		\tdplotdrawarc {(0,0,-\sintheta)} {\costheta} {0} {-180} {} {}
		\tdplotsinandcos {\sintheta}{\costheta}{30}
		\tdplotdrawarc {(0,0,-\sintheta)} {\costheta} {0} {-180} {} {}
		\tdplotsetthetaplanecoords{60}\tdplotdrawarc [tdplot_rotated_coords] {(0,0,0)} {1} {-180} {0} {} {}
		\node at (.4,.7) {$+$};	\node at (-.3,.7) {$-$};
		\node at (.6,-.1) {$-$};	\node at (-.3,-.1) {$+$};
		\node at (.4,-.8) {$+$};	\node at (-.2,-.8) {$-$};
	\end{tikzpicture}
	};
	\node [left=-.3em of p2,info box] {$l=3$\\$m=1$\\$l-m=2$};
	\node at (0,-2.5) (p3) {\begin{tikzpicture}
		\draw[tdplot_screen_coords, fill=white!70!gray] (0,0) circle (1);
		\tdplotsinandcos {\sintheta}{\costheta}{0}
		\tdplotdrawarc {(0,0,-\sintheta)} {\costheta} {0} {-180} {} {}
		\tdplotsetthetaplanecoords{35}\tdplotdrawarc [tdplot_rotated_coords] {(0,0,0)} {1} {0} {-180} {} {}
		\tdplotsetthetaplanecoords{125}\tdplotdrawarc [tdplot_rotated_coords] {(0,0,0)} {1} {0} {-180} {} {}
		\node at (-.85,.2) {$-$};	\node at (0,.4) {$+$};		\node at (.85,.3) {$-$};
		\node at (-.85,-.3) {$+$};		\node at (0,-.6) {$-$};		\node at (.85,-.3) {$+$};
	\end{tikzpicture}
	};
	\node [left=-.3em of p3,info box] {$l=3$\\$m=2$\\$l-m=1$};
	\node at (4,-2.5) (p4) {\begin{tikzpicture}
		\draw[tdplot_screen_coords, fill=white!70!gray] (0,0) circle (1);
		\tdplotsetthetaplanecoords{0}\tdplotdrawarc [tdplot_rotated_coords] {(0,0,0)} {1} {0} {-180} {} {}
		\tdplotsetthetaplanecoords{45}\tdplotdrawarc [tdplot_rotated_coords] {(0,0,0)} {1} {0} {-180} {} {}
		\tdplotsetthetaplanecoords{90}\tdplotdrawarc [tdplot_rotated_coords] {(0,0,0)} {1} {0} {-180} {} {}
		\tdplotsetthetaplanecoords{135}\tdplotdrawarc [tdplot_rotated_coords] {(0,0,0)} {1} {0} {-180} {} {}
		\node at (-.95,0) {$-$};	\node at (-.5,0) {$+$};
		\node at (.2,0) {$-$};		\node at (.8,0) {$+$};
	\end{tikzpicture}
	};
	\node [left=-.3em of p4,info box] {$l=3$\\$m=3$\\$l-m=0$};
	\node at (2,-5) (p5) {\begin{tikzpicture}
		\draw[tdplot_screen_coords, fill=white!70!gray] (0,0) circle (1);
		\tdplotsinandcos {\sintheta}{\costheta}{0}
		\tdplotdrawarc {(0,0,-\sintheta)} {\costheta} {0} {-190} {} {}
		\tdplotsinandcos {\sintheta}{\costheta}{-30}
		\tdplotdrawarc {(0,0,-\sintheta)} {\costheta} {0} {-190} {} {}
		\tdplotsinandcos {\sintheta}{\costheta}{30}
		\tdplotdrawarc {(0,0,-\sintheta)} {\costheta} {-20} {-180} {} {}
		\tdplotsetthetaplanecoords{40}\tdplotdrawarc [tdplot_rotated_coords] {(0,0,0)} {1} {0} {-180} {} {}
		\tdplotsetthetaplanecoords{130}\tdplotdrawarc [tdplot_rotated_coords] {(0,0,0)} {1} {0} {-180} {} {}
		\node at (-.65,.7) {$+$};	\node at (0,.7) {$-$};	\node at (.6,.7) {$+$};
		\node at (-.85,.2) {$-$};	\node at (0,.1) {$+$};	\node at (.8,.2) {$-$};
		\node at (-.7,-.7) {$-$};	\node at (0,-.8) {$+$};	\node at (.6,-.75) {$-$};
		\node at (-.85,-.3) {$+$};	\node at (0,-.4) {$-$};	\node at (.8,-.3) {$+$};
	\end{tikzpicture}
	};
	\node [left=-.3em of p5,info box] {$l=5$\\$m=2$\\$l-m=3$};
\end{tikzpicture}
\end{document}
|
Lizenz
Ich, der Urheber dieses Werkes, veröffentliche es unter der folgenden Lizenz:
Diese Datei ist lizenziert unter der Creative-Commons-Lizenz „Namensnennung – Weitergabe unter gleichen Bedingungen 4.0 international“.
- Dieses Werk darf von dir
- verbreitet werden – vervielfältigt, verbreitet und öffentlich zugänglich gemacht werden
- neu zusammengestellt werden – abgewandelt und bearbeitet werden
- Zu den folgenden Bedingungen:
- Namensnennung – Du musst angemessene Urheber- und Rechteangaben machen, einen Link zur Lizenz beifügen und angeben, ob Änderungen vorgenommen wurden. Diese Angaben dürfen in jeder angemessenen Art und Weise gemacht werden, allerdings nicht so, dass der Eindruck entsteht, der Lizenzgeber unterstütze gerade dich oder deine Nutzung besonders.
- Weitergabe unter gleichen Bedingungen – Wenn du das Material wiedermischst, transformierst oder darauf aufbaust, musst du deine Beiträge unter der gleichen oder einer kompatiblen Lizenz wie das Original verbreiten.
Dateiversionen
Klicke auf einen Zeitpunkt, um diese Version zu laden.
| Version vom | Vorschaubild | Maße | Benutzer | Kommentar | |
|---|---|---|---|---|---|
| aktuell | 01:43, 2. Dez. 2014 | | 265 × 251 (22 KB) | wikimediacommons>Krishnavedala | User created page with UploadWizard |
Dateiverwendung
Die folgenden 2 Seiten verwenden diese Datei: