Datei:Halogenated gas concentrations 1978-present.png
Größe dieser Vorschau: 800 × 516 Pixel. Weitere Auflösungen: 320 × 206 Pixel | 640 × 412 Pixel | 928 × 598 Pixel.
Originaldatei (928 × 598 Pixel, Dateigröße: 24 KB, MIME-Typ: image/png)
Beschreibung

|
Diese Datei könnte aktualisiert werden, um neue Informationen zu berücksichtigen. Falls die Verwendung einer bestimmten, nicht aktualisierten Version der Datei gewünscht wird, sollte die gewünschte Version separat hochgeladen werden. |
| Beschreibung |
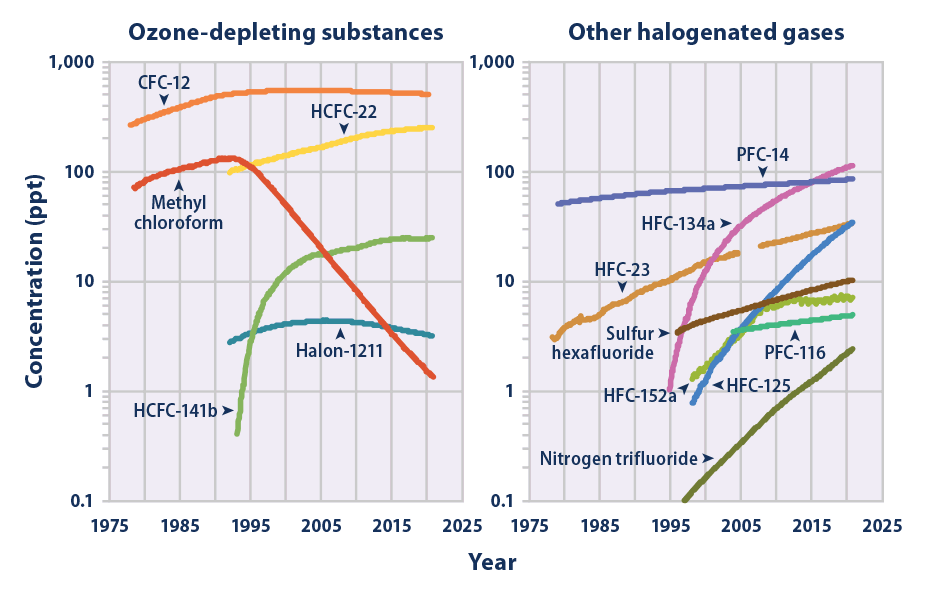
English: The two graphs show global changes in the concentration (measured in parts per trillion, or ppt) of several important halogenated gases in Earth's atmosphere. The data were collected from sites around the world between years 1978 and 2021. The left graph shows gases which cause substantial ozone depletion, as well as atmospheric heating. The right graph shows gases whose main impact is global warming.
All of the gases are human-made and manufactured in industrial amounts starting as early as the mid-twentieth century. Severe depletion of Earth's protective ozone layer inspired efforts to reduce the production of some gases starting the late 1980s. Overall, the manufacture of most other gases is still rapidly increasing, as indicated by the logarithmic scale used to graph the concentrations. Data Sources/References:
|
| Datum | |
| Quelle | https://www.epa.gov/climate-indicators/climate-change-indicators-atmospheric-concentrations-greenhouse-gases |
| Urheber | United States Environmental Protection Agency - Unauthored |
Lizenz
Diese Datei ist gemeinfrei (public domain), weil sie Material enthält, das von einem Angestellten der National Oceanic and Atmospheric Administration im Verlaufe seiner offiziellen Arbeit erstellt wurde.
|
Dateiversionen
Klicke auf einen Zeitpunkt, um diese Version zu laden.
| Version vom | Vorschaubild | Maße | Benutzer | Kommentar | |
|---|---|---|---|---|---|
| aktuell | 08:37, 29. Aug. 2022 | | 928 × 598 (24 KB) | wikimediacommons>A876 | updated by author to cover 1978-2021. |
Dateiverwendung
Die folgende Seite verwendet diese Datei: