Datei:Fourier transform time and frequency domains (small).gif

Aus besserwiki.de

Fourier_transform_time_and_frequency_domains_(small).gif(300 × 240 Pixel, Dateigröße: 265 KB, MIME-Typ: image/gif, Endlosschleife, 93 Bilder, 37 s)

Diese Datei stammt aus Wikimedia Commons und kann von anderen Projekten verwendet werden. Die Beschreibung von deren Dateibeschreibungsseite wird unten angezeigt.

Beschreibung
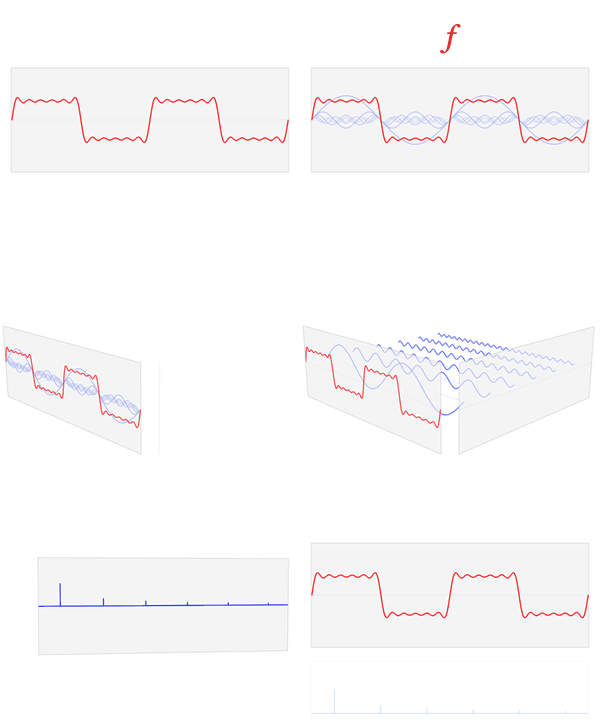
English: A visualization of the relationship between the time domain and the frequency domain of a function, based on its Fourier transform.

The Fourier transform takes an input function f (in red) in the "time domain" and converts it into a new function f-hat (in blue) in the "frequency domain".

In other words, the original function can be thought of as being "amplitude given time", and the Fourier transform of the function is "amplitude given frequency".

Shown here, a simple 6-component approximation of the square wave is decomposed (exactly, for simplicity) into 6 sine waves. These component frequencies show as very sharp peaks in the frequency domain of the function, shown as the blue graph.
Datum
Quelle Eigenes Werk
Urheber Lucas V. Barbosa
Genehmigung
(Weiternutzung dieser Datei)
Public domain Ich, der Urheberrechtsinhaber dieses Werkes, veröffentliche es als gemeinfrei. Dies gilt weltweit.
In manchen Staaten könnte dies rechtlich nicht möglich sein. Sofern dies der Fall ist:
Ich gewähre jedem das bedingungslose Recht, dieses Werk für jedweden Zweck zu nutzen, es sei denn, Bedingungen sind gesetzlich erforderlich.
Andere Versionen

Higher resolution:

(separate files were necessary due to the awfulness of MediaWiki's thumbnail generator)

Kurzbeschreibungen

Ergänze eine einzeilige Erklärung, was diese Datei darstellt.

In dieser Datei abgebildete Objekte

Motiv

Dateiversionen

Klicke auf einen Zeitpunkt, um diese Version zu laden.

Version vomVorschaubildMaßeBenutzerKommentar
aktuell22:44, 23. Feb. 2013Vorschaubild der Version vom 22:44, 23. Feb. 2013300 × 240 (265 KB)wikimediacommons>LucasVB{{Information |Description={{en|1=A visualization of the relationship between the time domain and the frequency domain of a function, based on its Fourier transform. The Fourier transform takes an input function f (in red) in the "time domain" and con...

Die folgende Seite verwendet diese Datei: