Datei:Example for addition of functions.svg

Größe der PNG-Vorschau dieser SVG-Datei: 487 × 367 Pixel. Weitere Auflösungen: 319 × 240 Pixel | 637 × 480 Pixel | 1.019 × 768 Pixel | 1.280 × 965 Pixel | 2.560 × 1.929 Pixel.
Originaldatei (SVG-Datei, Basisgröße: 487 × 367 Pixel, Dateigröße: 33 KB)
Beschreibung
| Beschreibung |
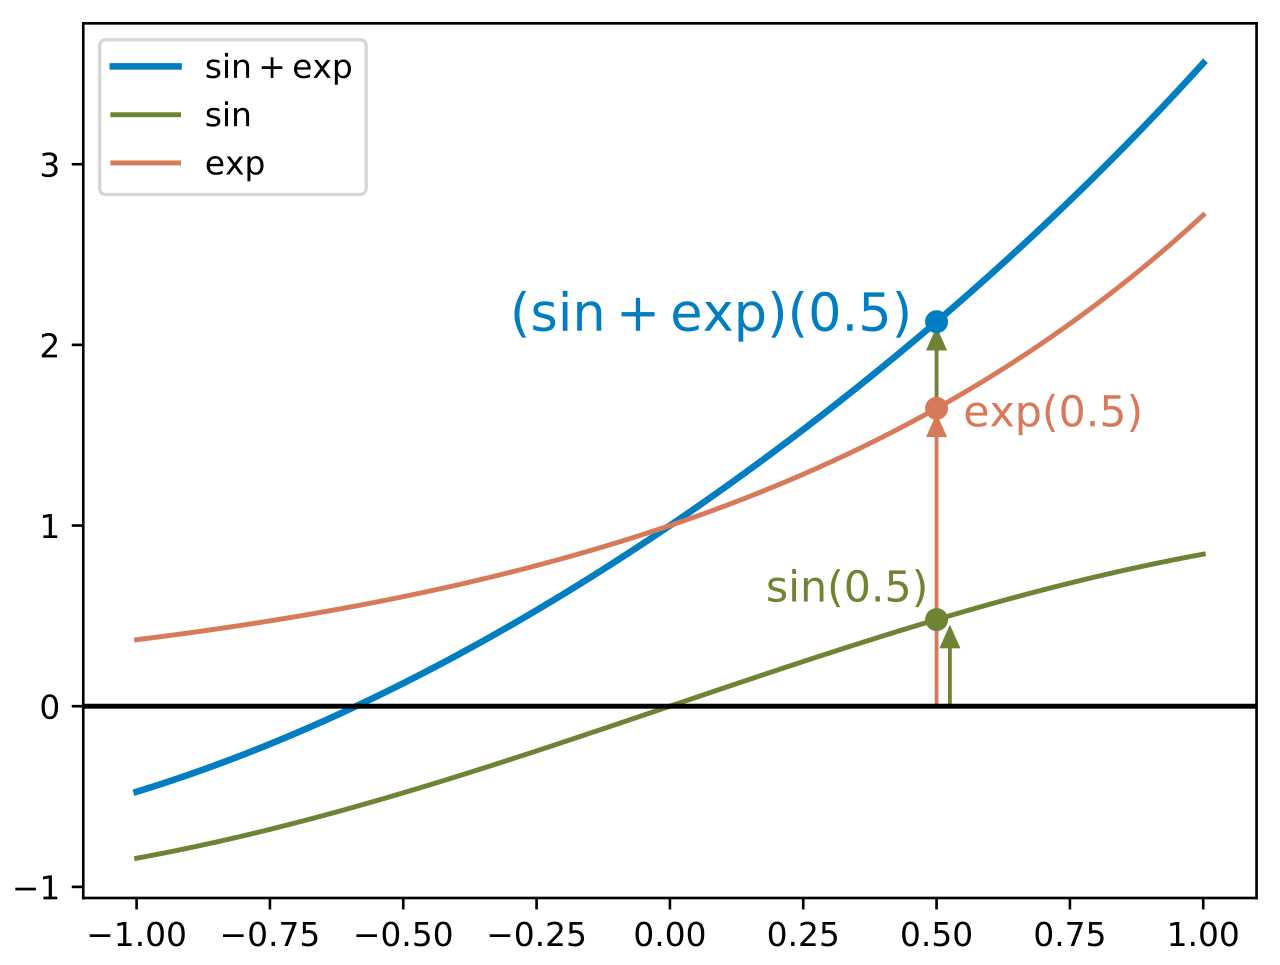
English: Addition of the function and to the function with . |
| Datum | |
| Quelle | Eigenes Werk |
| Urheber | Stephan Kulla (User:Stephan Kulla) |
| SVG‑Erstellung | Dieser Plot wurde mit Matplotlib erstellt. |
| Quelltext | Python codeimport matplotlib.pyplot as plt
import numpy as np
xs = np.linspace(-1, 1, 100)
ys1 = np.exp(xs)
ys2 = np.sin(xs)
ys3 = ys1 + ys2
fs = 13
x = 0.5
blue="#007ec1"
orange="#d77a5a"
green="#6e8334"
plt.plot(xs, ys3, color=blue, label="$\\sin+\\exp$", linewidth=2)
plt.arrow(x+2.5e-2, 0, 0, np.sin(x)-0.15, color=green, head_width=0.03, head_length=0.1)
plt.arrow(x, 0, 0, np.exp(x)-0.15, color=orange, head_width=0.03, head_length=0.1)
plt.arrow(x, np.exp(x), 0, np.sin(x)-0.15, color=green, head_width=0.03, head_length=0.1)
plt.plot(xs, ys2, color=green, label="$\\sin$")
plt.plot(xs, ys1, color=orange, label="$\\exp$")
plt.plot([x], [np.sin(x)+np.exp(x)], color=blue, marker="o")
plt.plot([x], [np.sin(x)], color=green, marker="o")
plt.plot([x], [np.exp(x)], color=orange, marker="o")
plt.text(x=0.18, y=np.sin(0.5)+0.1, s="$\\sin(0.5)$", color=green, fontsize=fs)
plt.text(x=0.55, y=np.exp(0.5)-0.1, s="$\\exp(0.5)$", color=orange, fontsize=fs)
plt.text(x=-0.3, y=np.sin(0.5)+np.exp(0.5)-0.05, s="$(\\sin+\\exp)(0.5)$", color=blue, fontsize=fs+3)
plt.legend()
plt.axhline(color="black")
plt.savefig("Example for addition of functions.svg", transparent=True, bbox_inches="tight", pad_inches=0.05)
|


Lizenz
Ich, der Urheber dieses Werkes, veröffentliche es unter der folgenden Lizenz:
| Diese Datei wird unter der Creative-Commons-Lizenz „CC0 1.0 Verzicht auf das Copyright“ zur Verfügung gestellt. | |
| Die Person, die das Werk mit diesem Dokument verbunden hat, übergibt dieses weltweit der Gemeinfreiheit, indem sie alle Urheberrechte und damit verbundenen weiteren Rechte – im Rahmen der jeweils geltenden gesetzlichen Bestimmungen – aufgibt. Das Werk kann – selbst für kommerzielle Zwecke – kopiert, modifiziert und weiterverteilt werden, ohne hierfür um Erlaubnis bitten zu müssen.
|
Dateiversionen
Klicke auf einen Zeitpunkt, um diese Version zu laden.
| Version vom | Vorschaubild | Maße | Benutzer | Kommentar | |
|---|---|---|---|---|---|
| aktuell | 01:25, 22. Feb. 2019 | | 487 × 367 (33 KB) | wikimediacommons>Stephan Kulla | User created page with UploadWizard |
Dateiverwendung
Die folgende Seite verwendet diese Datei: