Datei:Normal Distribution PDF.svg

Größe der PNG-Vorschau dieser SVG-Datei: 720 × 460 Pixel. Weitere Auflösungen: 320 × 204 Pixel | 640 × 409 Pixel | 1.024 × 654 Pixel | 1.280 × 818 Pixel | 2.560 × 1.636 Pixel.
Originaldatei (SVG-Datei, Basisgröße: 720 × 460 Pixel, Dateigröße: 63 KB)
Beschreibung
| Beschreibung |
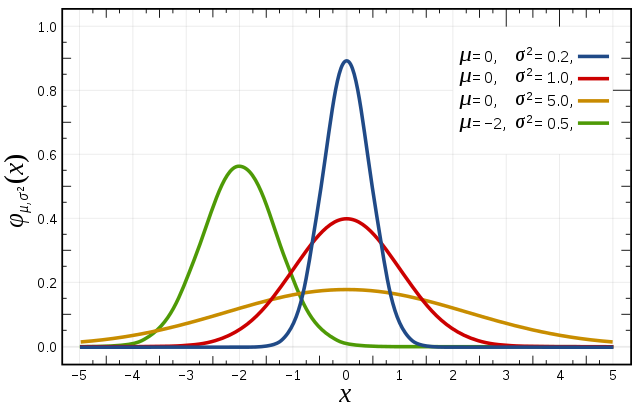
English: A selection of Normal Distribution Probability Density Functions (PDFs). Both the mean, μ, and variance, σ², are varied. The key is given on the graph. |
||
| Datum | |||
| Quelle | self-made, Mathematica, Inkscape | ||
| Urheber | Inductiveload | ||
| Genehmigung (Weiternutzung dieser Datei) |
|
||
| SVG‑Erstellung | Der Quelltext dieser SVG-Datei ist W3C-invalid wegen eines Fehlers. Dieses Chart verwendet Text-Einbettung. | ||
| Quelltext | R codePlot[
{
PDF[NormalDistribution[1, Sqrt[2]], x],
PDF[NormalDistribution[2, 1], x],
PDF[NormalDistribution[3, Sqrt[3]], x],
},
{x, -5, 5},
PlotRange -> All,
Axes -> False]
Data# Normal Distribution PDF
#range
x=seq(-5,5,length=200)
#plot each curve
plot(x,dnorm(x,mean=0,sd=sqrt(.2)),type="l",lwd=2,col="blue",main='Normal Distribution PDF',xlim=c(-5,5),ylim=c(0,1),xlab='X',
ylab='φμ, σ²(X)')
curve(dnorm(x,mean=0,sd=1), add=TRUE,type="l",lwd=2,col="red")
curve(dnorm(x,mean=0,sd=sqrt(5)), add=TRUE,type="l",lwd=2,col="brown")
curve(dnorm(x,mean=-2,sd=sqrt(.5)), add=TRUE,type="l",lwd=2,col="green")
Text# Normal Distribution
import numpy as np
import matplotlib.pyplot as plt
def make_gauss(N, sig, mu):
return lambda x: N/(sig * (2*np.pi)**.5) * np.e ** (-(x-mu)**2/(2 * sig**2))
def main():
ax = plt.figure().add_subplot(1,1,1)
x = np.arange(-5, 5, 0.01)
s = np.sqrt([0.2, 1, 5, 0.5])
m = [0, 0, 0, -2]
c = ['b','r','y','g']
for sig, mu, color in zip(s, m, c):
gauss = make_gauss(1, sig, mu)(x)
ax.plot(x, gauss, color, linewidth=2)
plt.xlim(-5, 5)
plt.ylim(0, 1)
plt.legend(['0.2', '1.0', '5.0', '0.5'], loc='best')
plt.show()
if __name__ == '__main__':
main()
|
Dateiversionen
Klicke auf einen Zeitpunkt, um diese Version zu laden.
| Version vom | Vorschaubild | Maße | Benutzer | Kommentar | |
|---|---|---|---|---|---|
| aktuell | 18:06, 29. Apr. 2016 | | 720 × 460 (63 KB) | wikimediacommons>Rayhem | Lighten background grid |
Dateiverwendung
Die folgende Seite verwendet diese Datei: