Datei:HATS Nitrous Oxide concentration.png
HATS_Nitrous_Oxide_concentration.png (695 × 406 Pixel, Dateigröße: 57 KB, MIME-Typ: image/png)
Beschreibung
| Beschreibung |
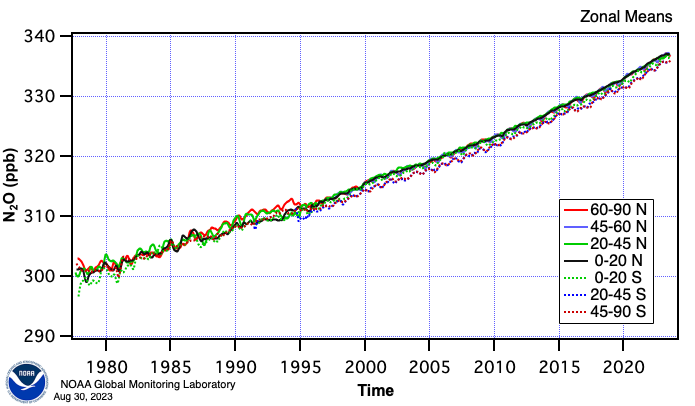
English: Graph shows the concentration of nitrous oxide ( N2O) in earth's atmosphere versus time and latitude. X-axis data interval is monthly. Y-axis concentration is parts per billion. Atmospheric samples were gathered within evacuated flasks from 8-12 ground stations distributed over the northern (positive latitudes) and southern hemispheres, then sealed and transported to Boulder Colorado for analysis. Most emissions originate at northern latitudes, and are mixed through the troposphere of both hemispheres after about 1-2 years. Data sampling and analysis by: |
| Datum | |
| Quelle | https://www.esrl.noaa.gov/gmd/hats/combined/N2O.html |
| Urheber | NOAA |
Lizenz
Diese Datei ist gemeinfrei (public domain), weil sie Material enthält, das von einem Angestellten der National Oceanic and Atmospheric Administration im Verlaufe seiner offiziellen Arbeit erstellt wurde.
|
Dateiversionen
Klicke auf einen Zeitpunkt, um diese Version zu laden.
| Version vom | Vorschaubild | Maße | Benutzer | Kommentar | |
|---|---|---|---|---|---|
| aktuell | 03:50, 9. Feb. 2024 | | 695 × 406 (57 KB) | wikimediacommons>Bikesrcool | update February 2024 |
Dateiverwendung
Die folgende Seite verwendet diese Datei: