Datei:Carbon basic phase diagram.png
Es ist keine höhere Auflösung vorhanden.
Carbon_basic_phase_diagram.png (672 × 509 Pixel, Dateigröße: 13 KB, MIME-Typ: image/png)

|
File:Carbon-phase-diagramp.svg ist eine vektorisierte Version dieses Bildes. Diese sollte an Stelle des Rasterbildes verwendet werden, sofern sie nicht schlechter ist.
File:Carbon basic phase diagram.png → File:Carbon-phase-diagramp.svg
Für weitere Informationen siehe Help:SVG. |
 |
Beschreibung
| Beschreibung |
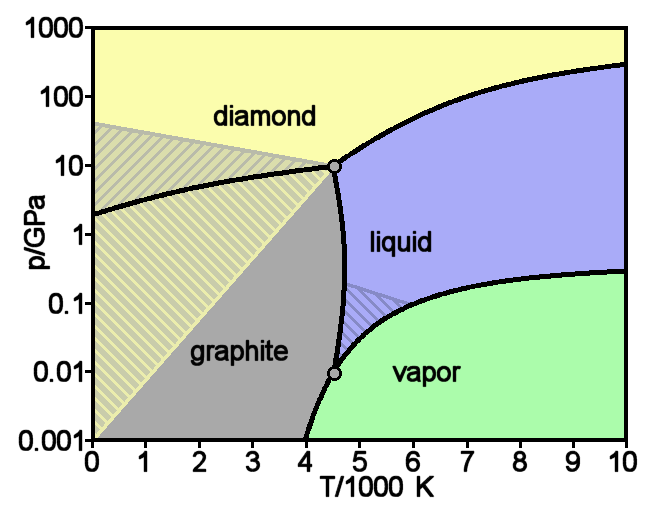
English: Theoretical phase diagram of carbon, which shows the state of matter for varying temperatures and pressures. The hatched regions indicate conditions under which one phase is metastable, so that two phases can coexist. The source reference says that the phase diagram is well established only up to around 100 GPa. More recent work shows that the melting point does not go as high as 10,000 K.
Accurate illustration but not a pixel-exact plot. Also note that a considerable disagreement exists between theory and experiment, e.g., for the triple point doi:10.1016/0008-6223(76)90010-5 |
| Datum | Source: English Wikipedia, original upload 16 April 2005 by Femto en:Image:Carbon basic phase diagram.png |
| Quelle |
Eigenes Werk mittels:
|
| Urheber | User name in der Wikipedia auf Englisch |
| Andere Versionen |
[]
.png:
.jpg:
|


| |
Dieses Werk wurde (oder wird hiermit) durch den Autor, Femto auf Wikimedia Commons , in die Gemeinfreiheit übergeben. Dies gilt weltweit. Falls dies rechtlich nicht möglich ist: |
Dateiversionen
Klicke auf einen Zeitpunkt, um diese Version zu laden.
| Version vom | Vorschaubild | Maße | Benutzer | Kommentar | |
|---|---|---|---|---|---|
| aktuell | 10:19, 7. Sep. 2005 | | 672 × 509 (13 KB) | wikimediacommons>Saperaud~commonswiki | Basic phase diagram of carbon, which shows the state of matter for varying temperatures and pressures. The hatched regions indicate conditions under which one phase is metastable, so that two phases can coexist. Accurate illustration but not a pixel-exac |
Dateiverwendung
Die folgende Seite verwendet diese Datei: